APPLIED INTELLIGENCE / Forecasting
See what demand history can tell you.
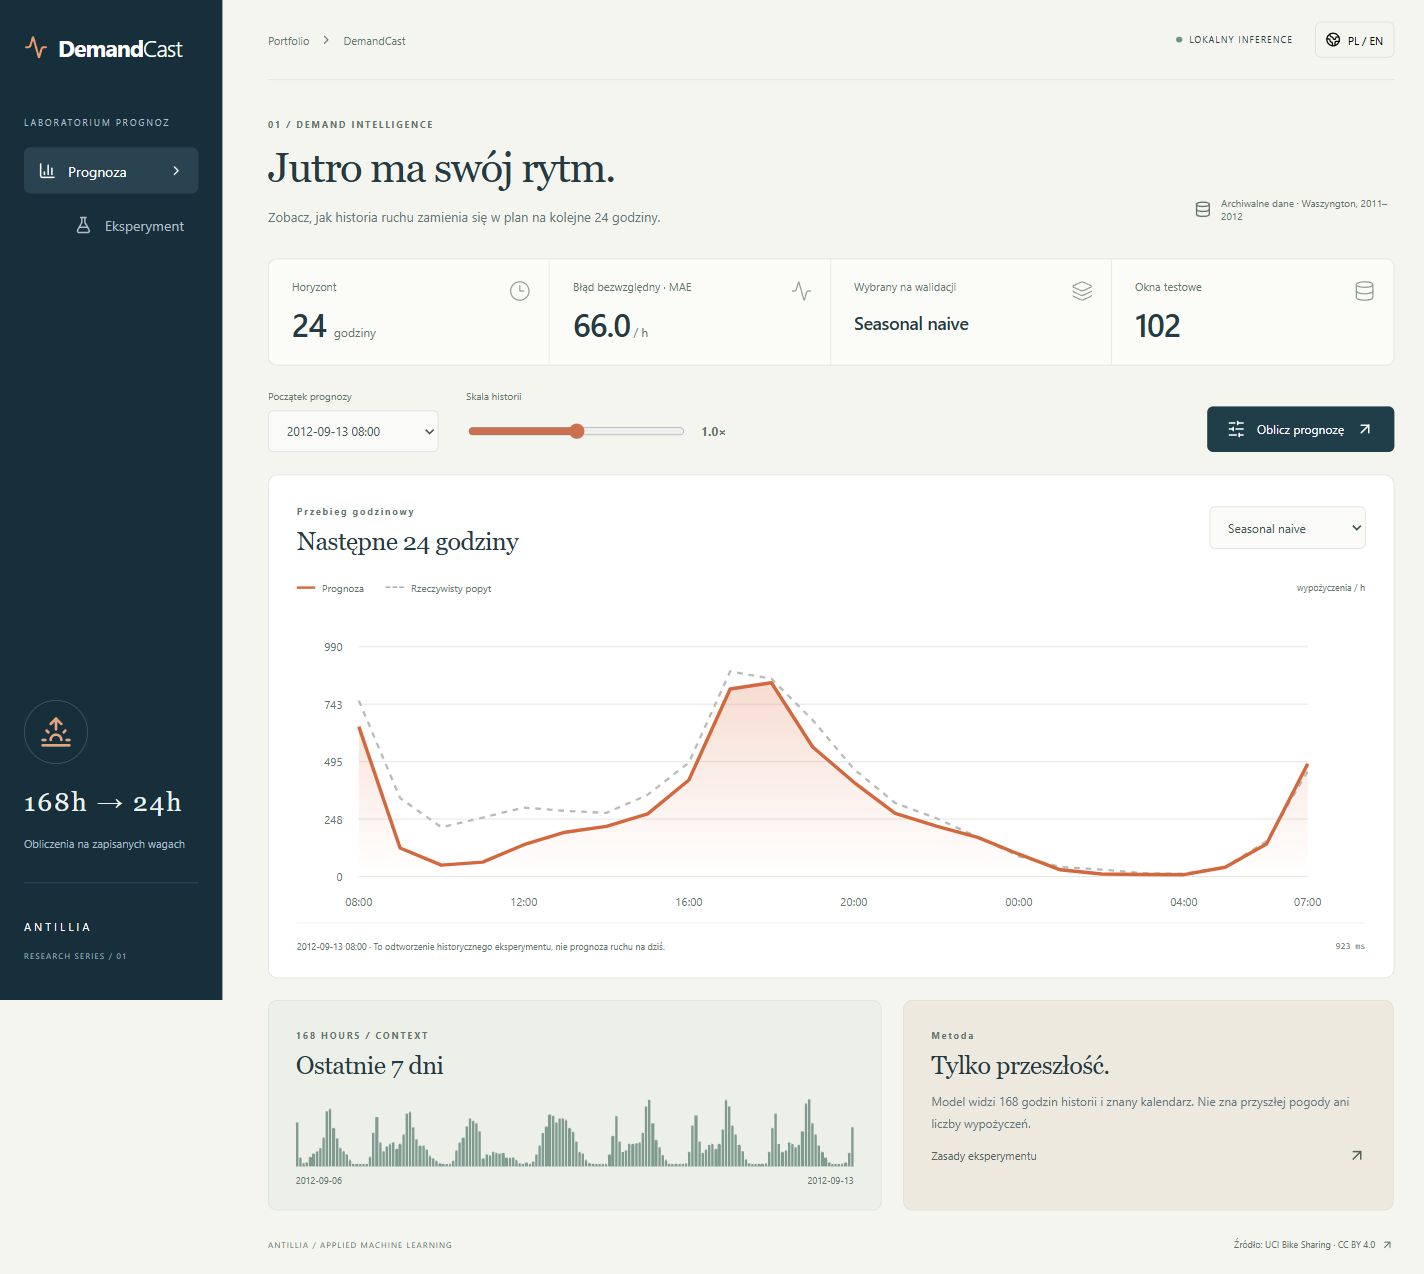
A 24-hour forecast compared with what actually happened.
Local experiment case study
Compare forecasts ↓Recorded local application view. This image is not an interactive interface.
EXPERIMENT EXPLORER
Forecast meets reality.
Choose a recorded window and compare models.
Historical results; no new training.
MAE / selected window66.21
Model forecastObserved demand
2012-09-13 08:00:00 · Seasonal baseline
View values in a table
Source: UCI Bike Sharing, CC BY 4.0. Data and forecasts from the published project report. MAE above describes the selected window, not the full test.
RESULT AND CONTEXT
What was tested.
66.01MAE · rentals / h
24 hForecast horizon
Method
168 hours of history and known calendar features. The seasonal baseline beat boosting and GRU on validation.
168 hours of history→24 forecast hours
Where this result stops
One city, 2011–2012 data. This is a historical experiment, not a forecast of current demand.
Results come from the project reports. This presentation does not include retraining or independent evaluation.